
Cause Mapping® Example:
This is an example of how the Cause Mapping process can be applied to a specific incident. In this case, the Hindenburg crash is captured as an example of the Cause Mapping method. The three steps are 1) Define the problem, 2) Conduct the analysis and 3) Identify the best solutions. Each step will be discussed below.
Step 1. Define the Problem
The first step of the Cause Mapping approach is to define the problem by asking the four questions: What is the problem? When did it happen? Where did it happen? And how did it impact the goals? One person may say that the problem was that the Hindenburg crashed. Another person might say that the problem was that the Hindenburg caught on fire, and a third person could say that the problem was that 36 people were killed. We can write down these three “problems” on the first line. In the Cause Mapping methodology, the facilitator anticipates that the group may disagree so all three responses are written down. There is no need to spend time debating the problem. The magnitude of this incident is defined by the impact to the goals.
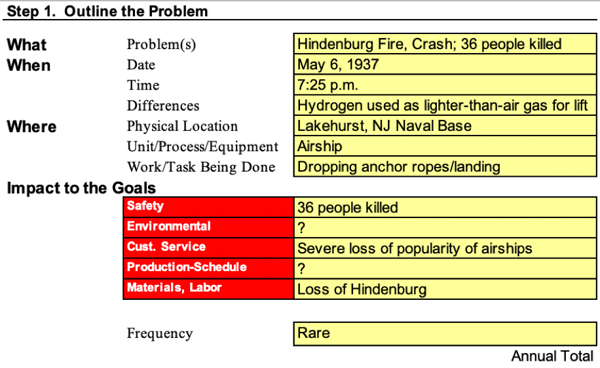
The second question is the “When?” which is the date and time of the incident. When captures the timing of the issue and also has a line for what was different or unusual in this occurrence. The question of what was different is fundamental in any investigation. On the Hindenburg issue we capture the date as May 6th, 1937 and the time of 7:25 when the airship caught fire, exploded and crashed (which all happened within a minute). For differences, we will put that Hindenburg was hydrogen-filled, unlike the helium-filled airships created in the United States.
In an investigation, there can be several pieces of information that need to be captured when specifying the location. At a minimum, the physical/geographic location and the process should be captured. The physical location is where geographically the incident happened. The Hindenburg crashed at the Lakehurst, N.J. Naval Base while dropping anchor ropes, or landing (the process).
The next section is the impact to the overall goals. On any commercial vessel, one of the overall goals is to have zero injuries. On the Hindenburg, there were 35 fatalities of the 97 people that were aboard and one fatality of a member of the ground crew. One of the other goals is to have no damage to the vessel. In the case of the Hindenburg, the entire vessel was destroyed. Additionally, the loss of the Hindenburg proved to cause a severe loss in the popularity of airships. I’m going to consider that a customer service goal. So, the three goals that are impacted in the Hindenburg example are the safety goal, the customer service and the material goal.
Step 2. Identify the Causes (The Analysis)
The analysis step is where the incident is broken down into causes which are captured on the Cause Map™ diagram. The Cause Map diagram starts by writing down the goals that were affected as defined in problem outline. For the Hindenburg the safety goal was impacted because of the 36 lives that were lost and the vessel goal was impacted because of the loss of the airship. The customer service goal was affected by the loss of popularity of airships. These are the first three cause-and-effect relationships in the analysis.
The analysis can continue by asking Why questions and moving to the right of either of the cause-and-effect relationships above. In this example, we’ll start with the loss of 36 lives and the loss of the Hindenburg, both of which were caused by the fire aboard. The loss of popularity of airships was caused by both the loss of the Hindenburg, and by the loss of lives. The next question is “Why did the fire occur?”
For the Hindenburg, this is where things start to get interesting. There are three separate theories about why the fire started. One theory is that the fire started from sabotage. Another theory is that the fire began when static electricity ignited the flammable cover of the airship. The other theory is that static electricity ignited a flammable hydrogen-oxygen mixture. Because we don’t know which of these causes actually produced the effect, we use a “?” after each cause and join them with “OR”. Note that we’re not espousing a theory – we are just recording all of the possibilities.
We can continue on each of these branches by asking why until we run out of answers. It is thought (by some) that static electricity ignited the highly flammable mix on the fabric cover. A combustible combination of materials was used to make the fabric cover, and thunderstorms in the area could have produced the static electricity.
Others believe that static electricity ignited a combustible mix of hydrogen and oxygen. The hydrogen was used for lift because helium was unavailable. The oxygen was in the air, and the suggested static electricity source was also from the thunderstorms, as discussed above.
Even more detail can be added to this Cause Map diagram as the analysis continues. As with any investigation, the level of detail in the analysis is based on the impact of the incident on the organization’s overall goals. The specific action items from the Hindenburg crash can be matched to specific causes on the detailed Cause Map analysis.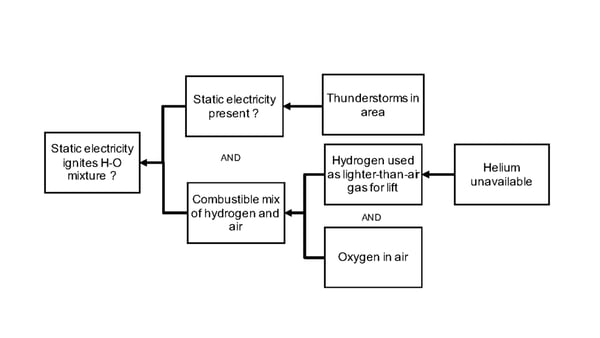
Step 3. Select the Best Solutions (Reduce the Risk)
Once the Cause Map diagram is built to a sufficient level of detail with supporting evidence the solutions step can be started. It is used to identify all the possible solutions for a given issue so that the best solutions can be selected. It is easier to identify many possible solutions from the detailed Cause Map diagram than the oversimplified high-level analysis of “Hindenburg started on fire because it went through a lightning storm.”
There are causes to every issue. The Hindenburg tragedy at a high level has only 8 potential, or partial, causes. At a more detailed level, it has 26 causes and 88 causes. All of the levels of the Cause Map analysis are accurate some simply have more detail than others. An issue should be worked to a sufficient level of detail to prevent the incident; meaning to reduce the risk of the incident occurring to an acceptable level. This is why solutions and work processes at a coffee shop are not as thorough or detailed as an airline or nuclear power facility. The risk or impact to the goals dictates how effective the solutions should be. Lower risk incidents will have relatively lower detail investigations while significantly high risk to an organization’s goals requires a much more thorough analysis. Below are some of the causes of solutions identified for the Hindenburg crash.
Cause Mapping Method Improves Problem Solving Skills
The Cause Mapping method focuses on the basics of the cause-and-effect principle so that it can be applied consistently to day-to-day issues as well as catastrophic, high-risk issues. The steps of the Cause Mapping method are the same, but the level of detail is different. Focusing on the basics of the cause-and-effect principle make the Cause Mapping approach to root cause analysis a simple and effective method for investigating safety, environmental, compliance, customer, production, equipment or service issues.
Click on “Download PDF” above to download a PDF showing the high-level Cause Map diagram.