Cause Mapping Example:
On July 17, 1996, TWA Flight 800 broke up in air offshore at East Moriches, New York. All 230 people on board were killed and the plane was completely destroyed.
Let’s examine the Cause Mapping process for the in-air break-up of TWA flight 800. The three steps are: 1) Define the problem, 2) Conduct the analysis and 3) Identify the best solutions. We’ll discuss each step below.
Step 1. Define the Problem
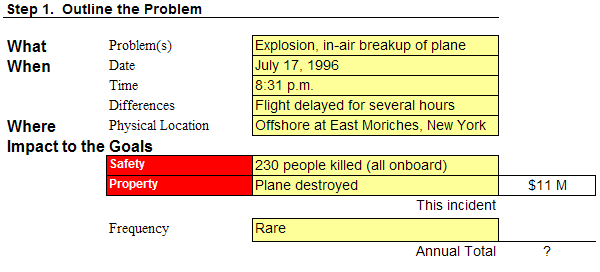
First we ask four basic questions in order to define the problem: What is the problem? When did it happen? Where did it happen? And how did it impact the goals? The problem here, which we can write down on the first line, is the break-up of TWA Flight 800. There is some disagreement about what caused this break-up, so we’ll just leave this for now. We’ll deal with the disagreements later. We also fill in when and where this happened, as well as any key differences. For TWA Flight 800, one of the noted differences between this flight and thousands of others taken by TWA is the fact that the flight was delayed.
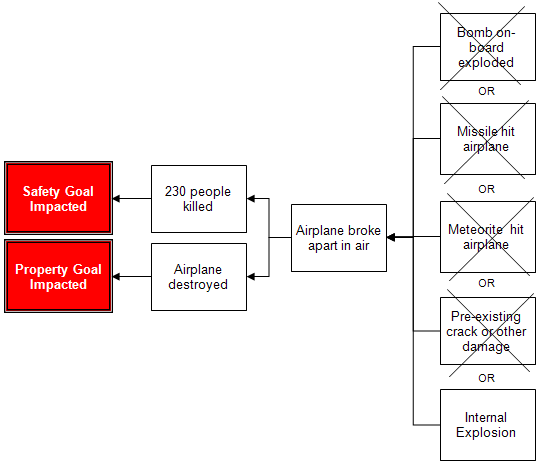
Finally, the magnitude of this incident is defined by the impact to the goals. Any time there is a loss of life or property, there is an impact to the goals. Here, our safety goal is impacted because 230 passengers and crew were killed. Obviously having zero fatalities is a very basic safety (and customer service) goal of a passenger airline. There’s also impact to a property goal because of the loss of the plane.
Step 2. Identify the Causes (The Analysis)
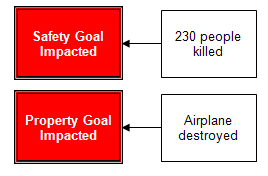
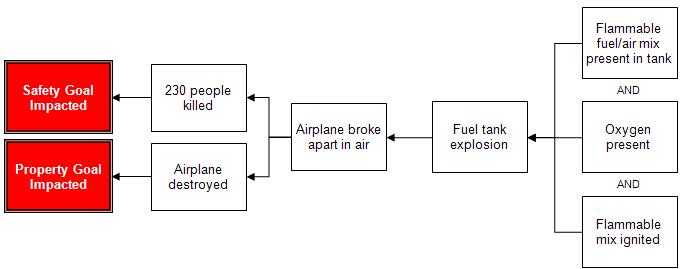
Now we need to break the incident down into causes. First, we examine the cause of our goals being impacted. Our safety goal was impacted because 230 people were killed. Our property goal was impacted because the airplane was destroyed.
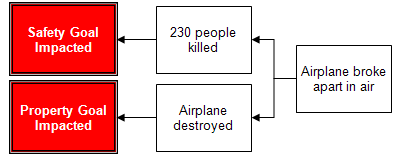
To continue the cause map, we keep asking “why?” The airplane was destroyed and the passengers and crew were killed because the airplane broke up in mid-air.
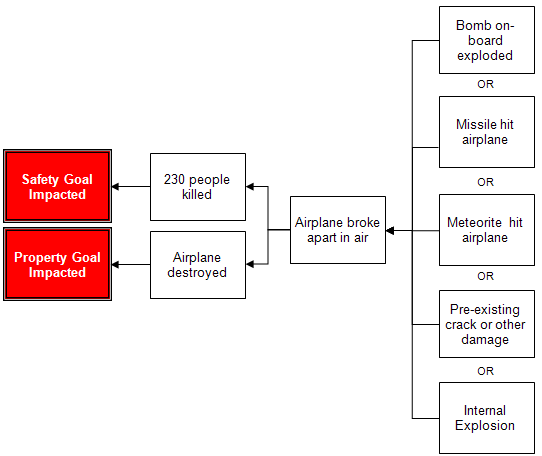
Now for the complicated part: Why did the airplane break up? For this exercise, first we’ll look at the point of view of the National Transportation Safety Board (NTSB), who was called upon to investigate. When they were first asked to investigate, they had to consider all potential causes of the break-up. The NTSB considered the following potential causes: a bomb, a missile hitting the plane, a meteorite, structural damage caused by pre-existing conditions (such as an existing crack), or an internal explosion. Note that we expect that one of these potential causes is the actual cause, so we separate the boxes with “OR”.
As you can imagine, to continue to answer “why?” we need to have some evidence. This is where the staff at NTSB examined the airplane wreckage and performed tests. Their conclusion was that the cause of the break-up was actually an internal explosion in one of the fuel tanks. Based on the condition of the wreckage, they determined that it was highly unlikely that the break-up had been caused by a bomb, a missile, a meteorite or pre-existing structural damage. There are still some people out there who disagree, but for this cause map, we’re going to trace out the conclusions of the NTSB. So, we’ll cross off the other possibilities that we examined, but found lacking. We do this to visually demonstrate that these were causes that were considered.
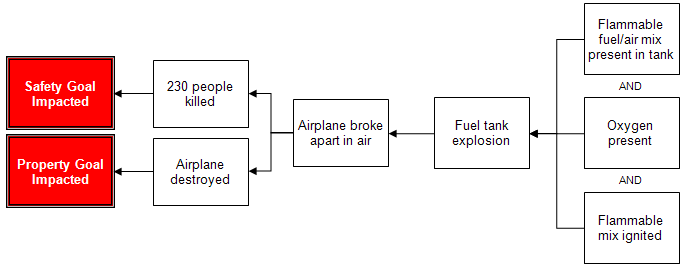
We continue our analysis by asking, “Why was there an internal explosion?” The internal explosion occurred in a fuel tank and it was caused by three things: 1) the fuel/air mixture in the tank was flammable, 2) the flammable mix was ignited, and 3) oxygen was present to facilitate the explosion. If any one of these three things had not happened, the explosion would not have happened. Since all three of things were required, we join the boxes with “AND.”
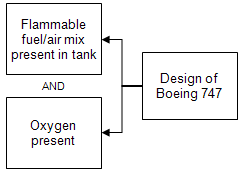
For our exercise, let’s continue to follow these branches. Why was the mix flammable? Why was there oxygen present? There was flammable fuel/air mixture and oxygen present because of the airplane design.
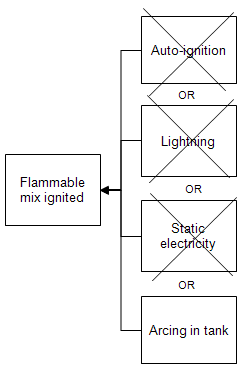
How was the mix ignited? Again, the NTSB examined every theory it had. The theories of how the tank was ignited included lightning, static electricity, arcing, and auto-ignition (a condition where the fuel or tank structure gets so hot that the fuel explodes without direct contact with an ignition source).
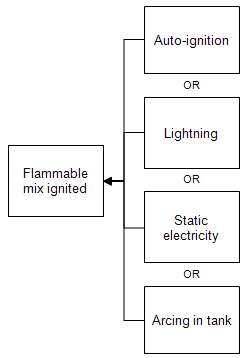
During their investigation, the NTSB narrowed down these categories by examining the wreckage, running tests, and reviewing witness testimony and meteorological reports. They determined that the most probable cause of ignition was arcing. So we will again cross off the other possibilities.
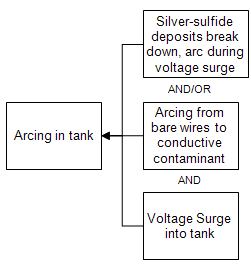
Why was there arcing? The NTSB found two potential causes for arcing. One was a voltage surge onto a silver-sulfide deposit, causing it to arc. The other was arcing from a bare wire to a conductive contaminant, also caused by a voltage surge. So, we see that a voltage surge is necessary for arcing. Then, the arcing could either be caused by the silver-sulfide deposits, or by a bare wire and a conductive contaminant. Since we’re not sure of the cause (the wire in the area was destroyed and so could not be examined), we’ll use “AND/OR” in our cause map.
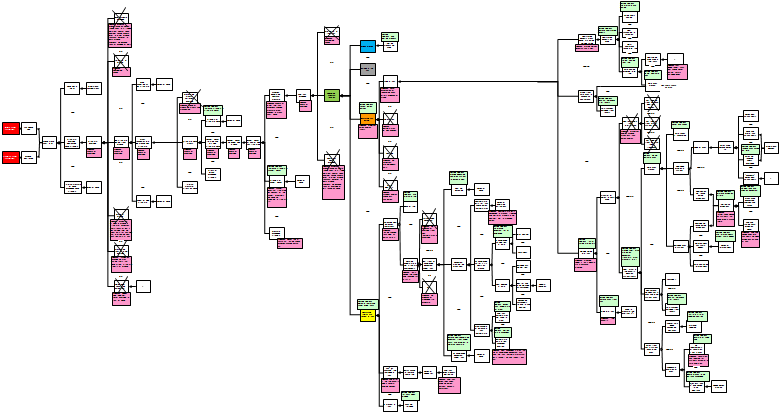
We can continue this cause map by continuing to ask, “Why?” The full, detailed cause map (shown at the bottom of the page) for this accident has over 120 causes.
Step 3. Select the Best Solutions (Reduce the Risk)
Once we have developed our cause map in sufficient detail, we can identify potential solutions. It is extremely important to wait until this phase, or solutions can be oversimplified. For example, if we developed solutions based on the cause map below, our best solutions might be: “Don’t allow flammable fuel/air mix in fuel tanks” and “Don’t allow ignition sources in the fuel tanks.” However, the first solution has been shown (thus far) to be impossible in practice. The second solution, “Don’t allow ignition sources” was how the airline industry (before the TWA Flight 800 break-up) did choose to deal with fuel tank flammability issues. That’s what got us into this mess in the first place.
If we base our solutions instead on the more detailed map shown below, we may come up with solutions such as, “Don’t allow bare wires in the fuel tank” or “Install equipment to prevent voltage surges”. These solutions offer more easily implemented and effective solutions. If you examine the detailed cause map, you may notice some solutions that have been implemented by the FAA for commercial travel since the tragedy of TWA Flight 800.
Cause Mapping Improves Problem Solving Skills
The Cause Mapping method focuses on the basics of the cause-and-effect principle so that it can be applied consistently to day-to-day issues as well as catastrophic, high risk issues. The steps of Cause Mapping are the same, but the level of detail is different. Focusing on the basics of the cause-and-effect principle make the Cause Mapping approach to root cause analysis a simple and effective method for investigating safety, environmental, compliance, customer, production, equipment or service issues.
Resources
The information used to make this Cause Map was obtained from the National Transportation Safety Board.
Bring Cause Mapping® Root Cause Analysis training to your site
Schedule a workshop at your location to train your team on how to lead, facilitate, and participate in a root cause analysis investigation.
