Root Cause Analysis Overview
US bridges have gotten some attention for potential structural issues. Some structural engineering experts have even suggested that up to 8000 US bridges are in need of remodeling.
However, the last truly fatal major US bridge collapse occurred in 2007. Three major bridges collapsed in the United States that year:
- Harp Road Bridge in Greys Harbor County, WA collapsed under the weight of a truck hauling an excavator (none killed or injured)
- MacArthur Maze in Oakland, CA collapsed when a fire from a tanker truck crash and explosion weakened steel support sections of the bridge (one injured in initial crash; no injuries from collapse)
- I-35 collapse in Minneapolis, MN
The I-35 Bridge stands out in this group for the tremendous damage it caused. It was the most expensive of the three collapses. More importantly, it was the only one of the three that was fatal. The bridge also had poor past assessments from US regulatory agencies, raising questions surrounding state upkeep and maintenance procedures.
A hindsight view of the collapse offers new knowledge of how we should maintain bridges. Our Cause Map, built through our own unique, rigorous method of Root Cause Analysis, aims to provide all important information and assess potential solutions by determining the acceptable level of risk.
Root Cause Analysis Step #1: Define the Problem
Defining the I-35 Bridge Collapse
Cause Mapping any incident requires first asking four questions:
What is the problem?
If you were facilitating a Cause Mapping session all of those who might have knowledge of the I-35 Bridge collapse an asked for the reason it fell, you would hear:
“It was the initial structure of the bridge.”
“Yes, but if periodic inspections had included the proper steps, the collapse could have been bypassed. THAT’S the root cause.”
“I think the problem is the fatalities. We really should focus on that because that’s what we want to prevent.”
And our Root Cause Analysis experts write all of these ideas down objectively, then analyze them later in our Root Cause Analysis exercise.
When did it happen?
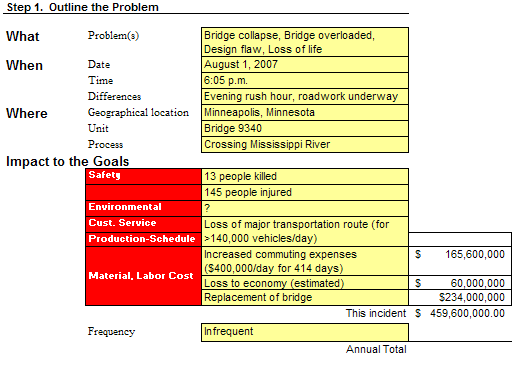
This is the “starting point” of the incident. This includes focusing on the specific time, date, and location of the incident. Fortunately, security cameras and traffic monitoring allow us to pinpoint the exact time when the bridge began to fall: 6:05 p.m. on August 1, 2007.
Aside from the collapsing bridge, we can also captures several key differences at the time of this incident as opposed to all the other times the bridge remained standing. These key fundamental differences help us better assess solutions once we complete our Cause Map. The bridge collapsed during evening rush hour, and there was roadwork underway on the bridge.
Where did it happen?
The incident took place while at Bridge 9340 in Minneapolis, Minnesota, which crossed the Mississippi River.
How did it impact the goals?
The collapse affected five distinct types of goals for the state: Safety, Environmental, Customer Service, Production/Schedule and Materials/Labor.
The Safety Goal is where we will start. The fatalities and injuries are our major overall concern. 13 people were killed and 145 were injured. The Environmental Goal impact in this case is also something the State of Minnesota would want to avoid, but we don’t know the exact fallout. So we add a question mark to that part of the description at the top of our Cause Map. That way, we can continue to consider this impact while we (or other researchers) continue to gather research about this impact.
The Customer Service Goal and Production/Schedule Goal were affected because the loss of the bridge represented the loss of a major transportation route for more than 140,000 vehicles a day. This results in a major inconvenience for citizens.
The commuting issue also directly impacted the Material/Labor Costs. The loss of the bridge resulted in an additional $400,000 per day in commuting costs. There were 414 days between the bridge collapse and the opening of the replacement bridge on September 18, 2008, resulting in a total of over $165 million. The estimated loss to the economy was $60 million. And the cost to replace the bridge was $234 million, for a grand total of almost half a billion dollars.
The last piece of information we want to record is the frequency of the incident. Since the Cause Map is created from the perspective of the State of Minnesota as the principal organization, we have filled out our outline from the State’s perspective. Catastrophic interstate bridge failures in Minnesota are infrequent.
Root Cause Analysis Step #2. Identify the Causes (Analysis)
I-35 Bridge Collapse Analysis
Writing down goals is a key starting point for any Root Cause Analysis. From there, the key is to ask why something happened and we can trace the incident’s causes to create a Cause Map, an extremely effective Root Cause Analysis tool.
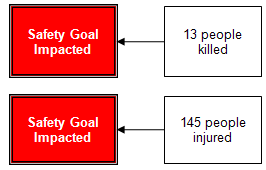
The lives of those injured and killed in this incident are the top priority in this situation, so we start with our safety goal and work directly backwards to injuries and fatalities. 13 people were killed and 145 were injured.
We continue to work backward by asking “Why?” each individual step in our Cause Map happened until we develop a chain of relationships between causes and potential causes. A good rule of thumb to begin a Cause Map is to simply ask “Why?” five times in a row. This is called “The Five Whys” method.
The deaths and injuries took place because the main span of the bridge collapsed.

This process continues as we build our Cause Map. Why did the main span of the bridge collapse? Because the gusset plate fractured.
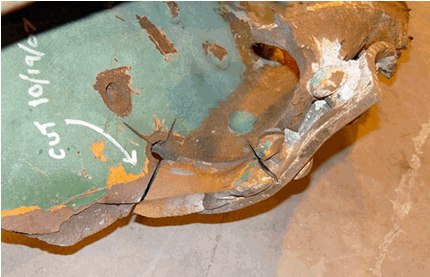
This image shows a fracture in a gusset plate that played a key role in the collapse of the Interstate 35W bridge. (National Transportation Safety Board photo)
To clarify, this is a photo of a gusset plate:
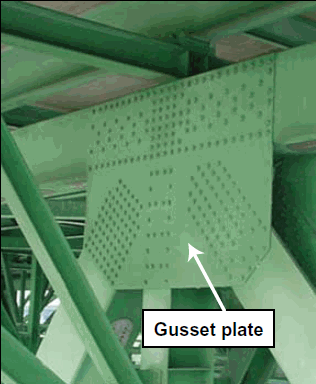
Interstate 35W Bridge Main Truss Node (National Transportation Safety Board photo)
You have probably seen these on bridges before. They are essential to the structural integrity of the bridge. Gusset plates support the joints of the bridge. In this case, the plate was the joint supporting the bridge’s main span. And why did the gusset plate fracture? Because of the insufficient load capacity of the gusset plate. Why was there insufficient load capacity? Because the calculations that determined the load capacity were not sufficient.

Since the purpose of Root Cause Analysis is to eventually pinpoint and select acceptable solutions, it may help to add detail to your steps as you are building your Cause Map. An accurate map is essential, but not always enough to help solve the problem as it relates to your actual goals.
Because of the fatalities associated with this bridge collapse, we are going to add all the detail we can, especially in an effort to address our Safety Goal.
We can add more detail in between the causes. For example, 13 people were killed because they were in vehicles that fell into the water. The main span of the bridge collapsing CAUSED the vehicles to fall into the water, which caused the deaths.

That helps us, because we now have a better understanding of the situation as well as more room for solutions. A real Cause Map is starting to form.
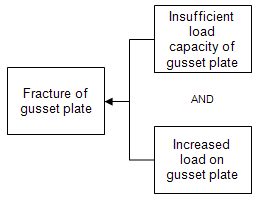
We can still improve it, though. Sometimes, a cause is preceded by two required causes. For example, to break a window requires both something to strike it and the glass to be fragile enough to break.
The same can be said of the fracturing of the gusset plate. While the load capacity was a problem, a heavy load also had to be placed on the bridge to provide enough pressure to fracture it.
We add our cause vertically and draw it like this:
We can take this a step farther, too. Sometimes, when looking at a past incident, a lack of evidence may leave things uncertain. To represent that on the Cause Map, we draw a vertical relationship between causes as we did in the graphic above, but use the word OR instead of AND. In reality, only one of the causes are legitimate, but if we don’t know which one it is, we can put this in as a placeholder to continue to solve our problems.
If we name particular causes, but later dispute them and rule them out, we can cross them off the list so we remember what we considered early in the investigation.
Early on in the investigation several possibilities that could have caused the fracture of the gusset plate were considered, and later refuted. We want people who look at our map to know we’ve considered these possibilities, so we leave them on the map, but cross them off. Possible causes for the fracture of the gusset plate that were considered, and then refuted, were corrosion damage, preexisting cracking, and temperature effects.
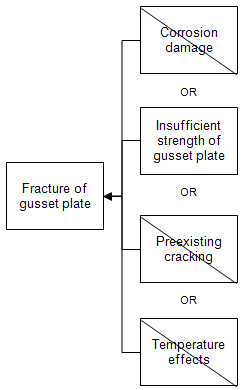
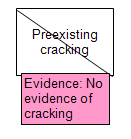
Then we face an even trickier possibility that we may rule out a cause because we miss a piece of evidence, later discover that evidence and have to reconsider the cause. One way to remember why we may have done this in the first place is to add the evidence we used to rule out the cause below the box.
At this point, our Cause Map looks like this:
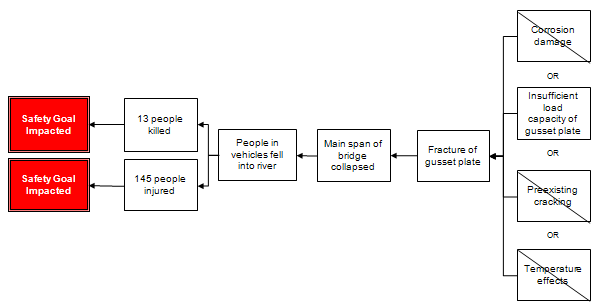
This Cause Map is more detailed than when we began, but there is still more helpful information we can add to the right by continuing to ask “Why?”
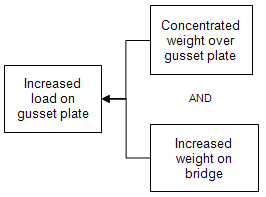
Why was there an increased load on the gusset plate? Because of the concentrated weight over the gusset plate and increased load on the bridge.
Why was there concentrated weight over the gusset plate? Because there were construction equipment and materials on the bridge, concentrated over the gusset plate.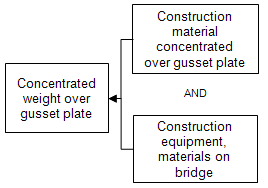
The increased weight on the bridge was a result of an increased dead load on the bridge and the high volume of traffic on the bridge. Why was there a high volume of traffic on the bridge? As we will show on the Cause Map, it was rush hour, half of the lanes were closed, and there was an increase in use of the bridge from the time it was built. Why were the lanes closed? A repaving job was underway.
We use the most specific possible numbers as evidence for the increase in use, showing the exact number of vehicles it was designed to handle and how many crossed it on a regular basis at the time it collapsed.
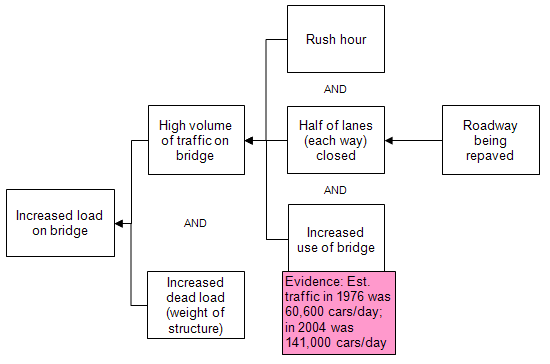
The increase in dead load was a result of two previous repairs. Those repairs were a result of the bridge’s not meeting updates safety standards, as well as to protect the rebar (reinforcement beam) of the bridge from corrosion.
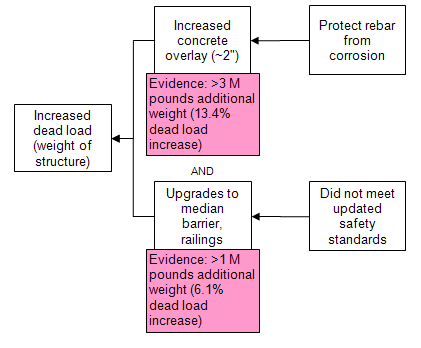
Cause Maps are excellent at demonstrating not only potential causes and solutions, but also the shortcomings of previous solutions and unintended results that may come from that decision. That way, organizations can keep that possibility in mind as they determine future solutions.
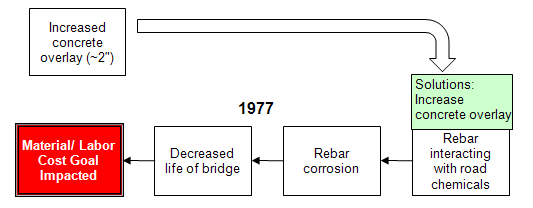
One of the causes in our Root Cause Analysis is an unintended result from a previous decision. In 1977, it was determined that there was an impact to the material and labor cost goal due to decreased life of the bridge. The decreased life was due to rebar corrosion from the rebar interacting with road chemicals. The solution was to increase the concrete overlay to protect the rebar.
Unfortunately, that solution became a cause in our Cause Map of the more recent bridge collapse.
Let’s return to a previous part of the map by focusing again on why the gusset plate fractured.
From here, diving deeper into these causes and building out a more detailed Cause Map will give us a better handle on the issue of weight on the bridge vs. the capacity to handle that weight.
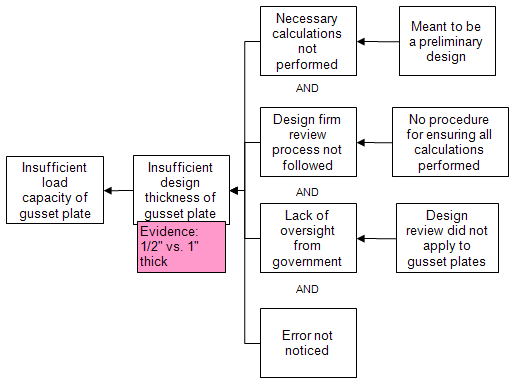
Why was the load capacity of the gusset plate insufficient? Because there was insufficient design thickness of the gusset plate, as is evidenced by its ½ inch thickness rather than the standard 1 inch.
This insufficient design thickness was caused by four equally important causes:
- Calculations necessary to create the proper design thickness were not performed
- The design firm review process was not followed
- There was lack of oversight from the government
- The error went unnoticed, leaving the bridge a 40 year window of opportunity to collapse
Three of these causes have their own immediate causes we can also draw out on the Cause Map. The necessary calculations were not performed because the design was meant to be preliminary. The design firm review process was not followed because there was no procedure for ensuring all calculations had been performed. And the lack of oversight from the government resulted from the government’s review process failing to apply to gusset plates.
As for the error going unnoticed, the State of Minnesota may be able to find really solid solutions in this part of the Cause Map. If an error goes unnoticed for 40 years, it would seem there are some basic checks that could be put in place to resolve the issue.
Why did the error go unnoticed? The two inspections that may have resolved the issue were the general bridge inspections and load rating inspections (load rating inspections determine the bridge’s weight limit).
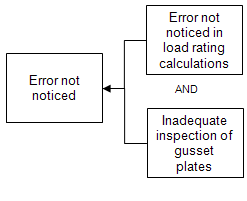
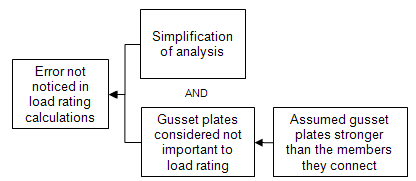
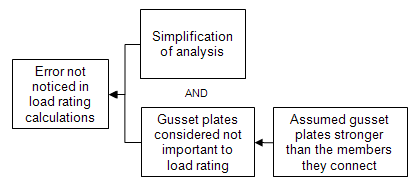
Even at this point, we can Cause Map useful, solution-focused steps to determine how the error went unnoticed in the load rating calculations. Gusset plates are not generally considered essential to the load rating and they were excluded to simplify overall analysis. The reason gusset plates are not considered important to the load rating is that there is a general assumption that gusset plates (the key joints on the bridge) are stronger than the parts they connect. And generally, this assumption is correct. However, the gusset plates in this case were not properly sized, thus compromising the strength of the bridge.
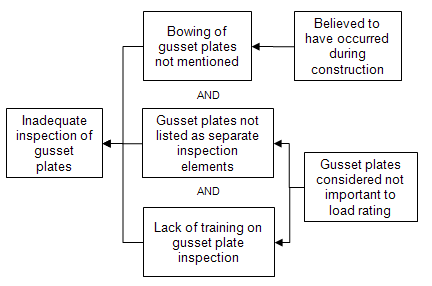
As for the second cause of the error going unnoticed (inadequate inspection of the gusset plates), we can extend our Cause Map and focus on three main reasons. The first is that the bowing (displacement) of the gusset plates went unmentioned. As you can imagine, displaced gusset plates can be detrimental to the structure of the bridge. Remember, gusset plates are joints that support other parts. The bowing of the plates is believed to have occurred during construction.
In addition to the bowing of the gusset plates, gusset plates were not listed as separate inspection elements and there was a lack of training on gusset plate inspection. These events occurred because the gusset plates were not considered an important part of the load rating.
Does this mean that discounting the importance of gusset plates to the load rating is THE root cause in our Root Cause Analysis? No.
But it does show that when you are building a Cause Map to perform extensive Root Cause Analysis of an incident, you may see a cause in multiple places.
The full Cause Map based on the information found in the NTSB report has more than 50 causes, but even more detail can be added for clarification or if additional information arises as part of the investigation. Again, due to the fatalities associated with the event, we want an extremely detailed Cause Map so we can perform a more complete root cause analysis.
Root Cause Analysis Step #3. Select the Best Solutions (Reduce the Risk)
Solving the I-35 Bridge Collapse
There are multiple causes to every issue. Depending on what level of detail you need to be able to solve your problem, you have the option of demonstrating as few or as many causes as necessary by using a Cause Map to perform root cause analysis rather than listing causes or attempting to pinpoint a root cause and stopping at that.
The detail in a given map should be worked to a point where risk can be reduced to an acceptable level. This is where debate between decision makers becomes constructive. The I-35 bridge collapse led to fatalities. Finding more causes of those fatalities may allow us to solve the issues that caused them.
Root Cause Analysis Solutions for the I-35 Bridge Collapse
With a solid, creative Cause Mapping facilitation, the organizations involved could collect an incredibly high number of potential solutions. Here are just a few of those solutions.
Solution #1: Limit Weight Concentration of Construction Materials
The concentration of weight over the gusset plate caused strain and contributed to the collapse of the bridge. Had this concentration not occurred, the collapse may have been prevented.
Solution #2: Require Written Permission for Staging Materials on Bridges
There is no policy requiring permission to stage materials on the bridge. Had a permit been required, they may never have been staged, thus preventing the concentration of weight on the gusset plate.
Solution #3: Ensure Bridge Construction Inspectors Receive Bridge Instruction Training
The same people who provide oversight for bridge instruction are tasked with inspecting the bridge at a later point. Cross-training these instructors would enable them to assess the condition of the bridge.
Solution #4: Recheck Weight Analyses After Dead Weight Increases
A check after the increase in the dead weight of the bridge would have provided a more realistic understanding of the bridge’s load capability.
Solution #5: Add Gusset Plates to Design Review
This is another place where the gusset plates can be double-checked.
Solution #6: Checklist to Make Sure All Calculations Have Been Performed
A checklist would have ensured that the design review process was followed.
Solution #7: Make Preliminary Designs Clearly
The designs for the bridge were meant to be preliminary. Clearly marking them as preliminary may have prevented them from being used as the official designs of the bridge.
Solution #8: Require Load Calculations before Use
Naturally, without load rating calculations required, the State of Minnesota was left more in the dark regarding the viability of the bridge.
Solution #9: Analyze Capacity of Gusset Plates
Rather than presume the strength of the gusset plates, an analysis of their capacity may have tipped off officials to potential problems.
Solution #10: Educate on the Importance of Gusset Plates
Gusset plates were not considered as part of the load rating. The importance of gusset plates is an essential consideration in this incident.
Solution #11: Verify Strength of Gusset Plates is Greater than the Parts that Depend on It (Members)
Normally, gusset plates are capable of supporting other parts. But when they are not properly sized, this may not happen. So verifying their strength would be useful.
Solution #12: List Gusset Plates as Specific, Separate Inspection Elements
These were not listed, contributing to an eventual incomplete review process. Listing them separately would lead to an individual, discriminating look at this essential part.
Solution #13: Add Specific Training on Gusset Plate Inspections
The process of designing, building and inspecting the bridge had plenty of assumptions. Training on the strength of gusset plates would have mitigated those assumptions with expertise.
I-35 Bridge Collapse Aftermath
Recovery efforts following the collapse of the bridge were “cautious” yet “deliberate” according to Minnesota Public Radio. Descriptions of the site were heart-breaking. Recovery teams had to balance the need for haste in saving any potential survivors with possible danger recovery team members might face. In at least two circumstances, recovery team members could see and speak with injured civilians in the wreckage but could only watch as they passed away.
The National Transportation Safety Board (NTSB) conducted a thorough investigation after the incident. One NTSB employee had written a doctoral thesis on the potential collapse scenarios of the bridge. The thesis became an investigative tool for the incident. The Federal Highway Administration (FHWA) also investigated the incident, creating a computer-generated model of the bridge and contributing that tool as part of the investigative process. The FHWA advised states to inspect 700 bridges of similar structure after its investigation.
Thanks to the improvements made after the I-35 Bridge tragedy, future collapses of this kind are highly unlikely. The aftermath investigation has taught construction crews several prevention strategies, avoiding future damage that might occur as fallout from such a collapse.
Interested in another structural failure Cause Map? Check out:
Bring Cause Mapping® Root Cause Analysis training to your site
Schedule a workshop at your location to train your team on how to lead, facilitate, and participate in a root cause analysis investigation.
