
Cause Mapping Example:
This is an example of how the Cause Mapping process can be applied to a specific incident. In this case the Yarnell Hill Fire is captured as an example of the Cause Mapping method. The three steps are 1) Define the problem, 2) Conduct the analysis and 3) Identify the best solutions. Each step will be discussed below.
Step 1. Define the Problem
The first step of the Cause Mapping approach is to define the problem by asking four questions: What is the problem? When did it happen? Where did it happen? And how did it impact the goals?
One person may say that the problem was 19 firefighters were killed. Another person might say that the problem was there was a wildland fire, and a third person could say that the problem was excessive, dry brush in the area. We can write down these three “problems” on the first line. In the Cause Mapping methodology the facilitator anticipates that the group may disagree so all three responses are written down. There is no need to spend time debating the problem. The magnitude of this incident is defined by the impact to the goals.
The second question is the “When?” which is the date and time of the incident. When captures the timing of the issue and also has a line for what was different or unusual in this occurrence. The question of what was different is fundamental in any investigation. On the Yarnell Hill Fire issue we capture the date as June 30, 2013 and the time is noted as N/A (not necessarily applicable in this incident discussion). The fact that the Yarnell Hill area had not experienced a significant wildland fire in 45 years and there were extreme drought conditions is captured as different or unusual. Whether these details are causally related will be determined in the analysis.
In an investigation there can be several pieces of information that need to be captured when specifying the location. At a minimum the physical/geographic location and the process should be captured. The physical location is where geographically the incident happened. The process or task being performed is what was going on when the incident occurred.
The next section is the impact to the overall goals. In wildland fire response, one of the overall goals is to have zero injuries. On the Yarnell Hill Fire there were 19 fatalities, the largest loss of life in a wildland fire since 1933. Although there are other wildland fire response goals, the signficant impact to the safety goal in this incident makes the other impacts far less signficant. For this example, we will focus on the impact to the safety goal.
Step 2. Identify the Causes (The Analysis)
The analysis step is where the incident is broken down into causes which are captured on the Cause Map. The Cause Map starts by writing down the goals that were affected as defined in the problem outline. For the Yarnell Hill Fire the safety goal was impacted because of the 19 firefighter lives that were lost. This is the first cause-and-effect relationship in the analysis.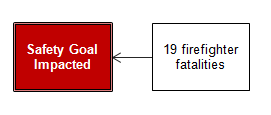
The analysis can continue by asking Why questions and moving to the right of the cause-and-effect relationship above. The next question is “Why were there 19 firefighter fatalities?” There were 19 firefighter fatalities because they were overcome by wildland fire. In addition to being overcome by the wildland fire, the rescue attempt was ineffective.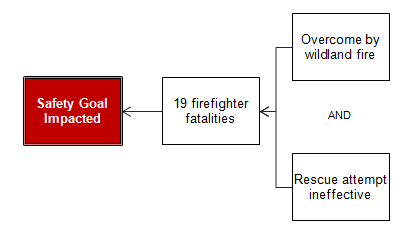
We can continue to expand the analysis by continuing to ask “Why” questions on either of these branches. The firefighters were overcome by the wildland fire because they were in the path of the fire and because there was a large wildland fire. There was a large wildland fire because of what was initially a small wildland fire, which was started by lightning strike and spread rapidly. It spread rapdily because of the presence of heavy, dry brush and because the attempt to contain and suppress the fire was ineffective. Both of these causes can continue to be expanded to better understand the specific causes of the incident.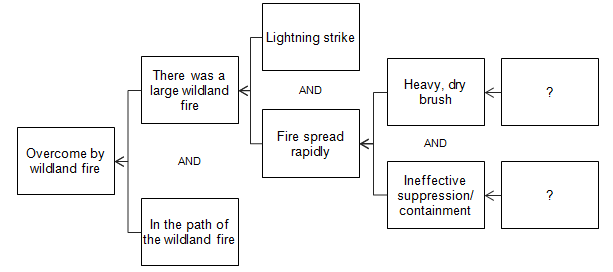
If we ask “Why was the crew in the path of the wildland fire?” we can identify that they were heading to a previously identified safety zone, that they had ineffectively assessed their escape route, and that they were unaware of the speed and direction of the fire. The assessment of the escape route was ineffective because they did not have a map of the area, as one had not been provided to them prior to going to the fire line. They were unaware of the speed and direction of the fire because they did not anticipate the weather shift and because their location in the canyon limited their visibility of the fire. They did not anticipate the weather shift because the last weather update was ~50 minutes old, coming officially through the FBAN (fire behavior analyst).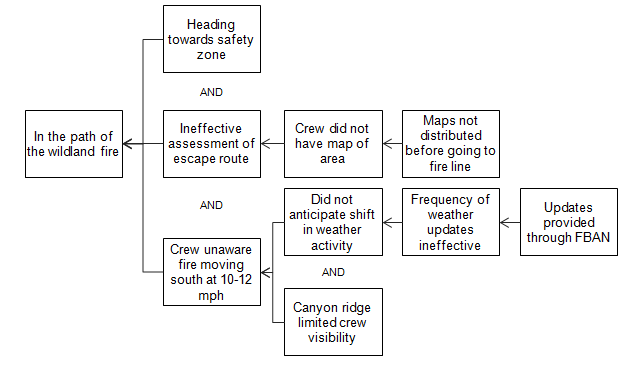
If we go back to the beginning of the map and ask “Why was the rescue attempt ineffective?” we can identify that the rescue personnel were unaware of the exact location of the crew. This was because the crew’s last known location was ~1 mile north during their last radio communication ~30 minutes prior. The radio communication was ineffective because of high radio traffic (fire was approaching town of Yarnell) and potential radio technical issues. The radios had not been re-programmed prior to the crew going to the fire line. Notice the use of the question mark when we identify a possible cause. A possible cause is lacking evidence.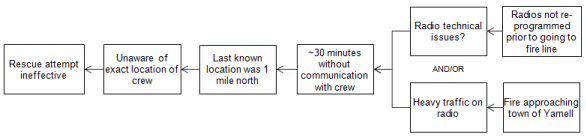
Even more detail can be added to this Cause Map as the analysis continues. As with any investigation the level of detail in the analysis is based on the impact of the incident on the organization’s overall goals. In addition, the analysis should go as far as you need to get to specific, actionable solutions. The specific action items from the Yarnell Hill Fire can be matched to specific causes on the detailed Cause Map.
Step 3. Select the Best Solutions (Reduce the Risk)
Once the Cause Map is built to a sufficient level of detail with supporting evidence the solutions step can be started. The Cause Map is used to identify all the possible solutions for a given issue so that the best solutions can be selected. It is easier to identify many possible solutions from the detailed Cause Map than the oversimplified high level analysis. However, even with our simplified analysis you can start to identify possible solutions. For example, in order to more quickly identify the exact locations of firefighters in trouble, consider using GPS technology. To address the need for the most up-to-date, by the minute, weather forecast, consider allowing the crews to have an independent means of getting weather updates, versus relying on the fire behavior analyst. To address the presence of heavy, dry brush in the area, review the strategic plan for fuel management (controlled burns), especially in drought conditions where the likelihood of wildland fire is high.
Cause Mapping Improves Problem Solving Skills
The Cause Mapping method focuses on the basics of the cause-and-effect principle so that it can be applied consistently to day-to-day issues as well as catastrophic, high risk issues. The steps of Cause Mapping are the same, but the level of detail is different. Focusing on the basics of the cause-and-effect principle make the Cause Mapping approach to root cause analysis a simple and effective method for investigating safety, environmental, compliance, customer, production, equipment or service issues.
Click on “Download” above to download a PDF showing the Root Cause Analysis Investigation.